



The latest completed meeting between Philadelphia and New York ended with the Eagles winning 38–20 on October 26, 2025, at Lincoln Financial Field. Jalen Hurts threw four touchdown passes, Saquon Barkley rushed for 150 yards, and Tank Bigsby added 104 rushing yards. New York quarterback Jaxson Dart passed for 193 yards and accounted for two touchdowns, but the Giants could not overcome Philadelphia’s overwhelming 276–68 advantage on the ground.
- Latest Eagles vs Giants match snapshot
- Philadelphia Eagles vs New York Giants match player stats at a glance
- Quarterback comparison: Jalen Hurts vs Jaxson Dart
- Why Philadelphia’s rushing attack decided the game
- Receiving leaders and red-zone production
- Defensive player stats and pass-rush impact
- Team stats that explain Philadelphia’s 38–20 win
- 1. Philadelphia gained 181 more total yards
- 2. The Eagles were perfect in the red zone
- 3. Turnovers were not the deciding factor
- What changed from the Giants’ Week 6 victory?
- Biggest individual performances
- 1. Saquon Barkley
- 2. Jalen Hurts
- 3. Tank Bigsby
- 4. Dallas Goedert
- 5. Philadelphia’s defensive front
- 6. Jaxson Dart
- What the box score means for fans and analysts
- More Sports Profiles: Chicago Cubs vs Milwaukee Brewers Match Player Stats
- Conclusion
- Frequently asked questions
- Who won the latest Eagles vs Giants game?
- What were Jalen Hurts’ statistics against the Giants?
- How many rushing yards did Saquon Barkley have?
- What were Jaxson Dart’s player stats?
- Who led the game in receiving yards?
- How did the Eagles win despite struggling on third down?
- Did the Eagles and Giants split their 2025 games?
- What is the all-time Eagles vs Giants record?
The score tells only part of the story. Philadelphia did not need a high-volume passing attack. Instead, it combined explosive rushing plays, perfect red-zone execution, and five defensive sacks to take control of the rematch.
Latest Eagles vs Giants match snapshot
| Match detail | Result |
| Date | October 26, 2025 |
| Competition | 2025 NFL regular season, Week 8 |
| Venue | Lincoln Financial Field, Philadelphia |
| Final score | Eagles 38, Giants 20 |
| Halftime score | Eagles 21, Giants 10 |
| Eagles record after the game | 6–2 |
| Giants’ record after the game | 2–6 |
Philadelphia scored 14 points in both the second and fourth quarters. New York remained within 11 points at halftime, but the Eagles’ running game and red-zone efficiency prevented the Giants from producing a meaningful second-half comeback.
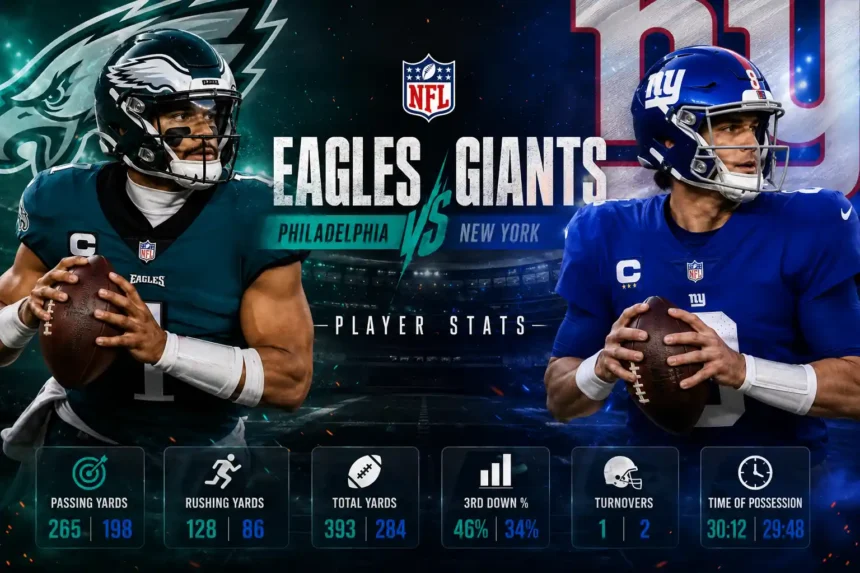
Philadelphia Eagles vs New York Giants match player stats at a glance
| Player | Team | Key statistics |
| Jalen Hurts | Eagles | 15/20, 179 passing yards, 4 TD, 0 INT |
| Saquon Barkley | Eagles | 14 carries, 150 yards, 1 rushing TD; 4 catches, 24 yards, 1 receiving TD |
| Tank Bigsby | Eagles | 9 carries, 104 yards |
| DeVonta Smith | Eagles | 6 receptions, 84 yards |
| Dallas Goedert | Eagles | 3 receptions, 28 yards, 2 TD |
| Jahan Dotson | Eagles | 1 reception, 40 yards, 1 TD |
| Jaxson Dart | Giants | 14/24, 193 passing yards, 1 TD, 0 INT; 17 rushing yards, 1 TD |
| Wan’Dale Robinson | Giants | 3 receptions, 48 yards |
| Tyrone Tracy Jr. | Giants | 10 carries, 39 yards; 2 receptions, 14 yards |
| Cam Skattebo | Giants | 3 carries, 12 yards; 18-yard receiving TD |
The official box score shows that Philadelphia’s most productive players contributed in different ways. Hurts delivered touchdowns through the air, Barkley created the game’s biggest rushing play, Bigsby maintained the ground-game advantage, and Goedert converted limited receiving volume into two scores.
Quarterback comparison: Jalen Hurts vs Jaxson Dart
| Statistic | Jalen Hurts | Jaxson Dart |
| Completions/attempts | 15/20 | 14/24 |
| Completion rate | 75.0% | 58.3% |
| Passing yards | 179 | 193 |
| Passing touchdowns | 4 | 1 |
| Interceptions | 0 | 0 |
| Passer rating | 141.5 | 98.1 |
| Sacks taken | 4 | 5 |
| Rushing yards | 22 | 17 |
| Rushing touchdowns | 0 | 1 |
Dart finished with 14 more gross passing yards, but Hurts produced the far more valuable performance. He completed three-quarters of his throws and recorded a touchdown on four of his 20 attempts.
Hurts also protected the football. With neither quarterback throwing an interception, the difference came from finishing drives. All four Philadelphia touchdown passes went to players in scoring position or on an explosive downfield play.
Dart had several productive moments. He connected with Cam Skattebo for an 18-yard touchdown and later scored on a two-yard run. However, five sacks repeatedly placed the Giants behind schedule and reduced their official net passing total to 178 yards.
Why passing-yard totals can look inconsistent
Individual passing yards and team net passing yards are not always identical.
Dart recorded 193 passing yards, but the Giants finished with 178 net passing yards because sack yardage is subtracted from the team total. Hurts threw for 179 yards, while Philadelphia’s four sacks allowed reduced its net passing figure to 151.
That distinction matters because a basic team-stat table can make it appear that both quarterbacks threw for fewer yards than their individual records show.
Why Philadelphia’s rushing attack decided the game
The clearest explanation for the 18-point margin is the rushing comparison:
| Rushing category | Eagles | Giants |
| Attempts | 33 | 21 |
| Yards | 276 | 68 |
| Average per carry | 8.4 | 3.2 |
| Longest run | 65 | 8 |
| Rushing touchdowns | 1 | 1 |
Philadelphia gained 208 more rushing yards and averaged more than five additional yards per attempt. The Eagles also produced two 100-yard rushers, while no Giants player reached 40 yards on the ground.
Saquon Barkley established control immediately.
Barkley scored on a 65-yard run on Philadelphia’s second offensive play. The touchdown gave the Eagles an immediate lead and forced New York to respect the possibility of another explosive run for the rest of the game.
He finished with:
- 14 carries
- 150 rushing yards
- 10.7 yards per carry
- One rushing touchdown
- Four receptions
- 24 receiving yards
- One receiving touchdown
Barkley generated 174 yards from scrimmage and two scores on only 18 offensive touches. His nine-yard touchdown reception in the second quarter restored Philadelphia’s lead after the Giants had tied the game.
Tank Bigsby punished a tired defense.
Bigsby carried nine times for 104 yards, averaging 11.6 yards per attempt. His longest run covered 29 yards and came during a second-and-26 situation on the drive that ended with Goedert’s second touchdown.
The combination of Barkley and Bigsby gave Philadelphia two running backs with more than 100 yards in the same game. The Eagles’ official coverage noted that Bigsby had entered the matchup with only one previous carry for the team.
Bigsby’s production mattered beyond the raw total. Philadelphia did not lose its rushing efficiency when Barkley left the primary rotation. The Giants still had to defend fresh legs, outside runs, and downhill concepts late in the game.
Receiving leaders and red-zone production
Philadelphia receiving statistics
| Receiver | Receptions | Targets | Yards | Touchdowns |
| DeVonta Smith | 6 | 9 | 84 | 0 |
| Saquon Barkley | 4 | 5 | 24 | 1 |
| Dallas Goedert | 3 | 3 | 28 | 2 |
| Jahan Dotson | 1 | 2 | 40 | 1 |
| Xavier Gipson | 1 | 1 | 3 | 0 |
Smith led Philadelphia in receptions and receiving yards. He did not score, but his catches helped move the offense into scoring position.
Goedert produced the most efficient scoring line. He caught all three of his targets, with two receptions resulting in touchdowns. Dotson supplied the longest Philadelphia reception when he won a contested catch for a 40-yard fourth-quarter score.
New York receiving statistics
| Receiver | Receptions | Targets | Yards | Touchdowns |
| Wan’Dale Robinson | 3 | 4 | 48 | 0 |
| Devin Singletary | 1 | 1 | 28 | 0 |
| Darius Slayton | 2 | 5 | 26 | 0 |
| Daniel Bellinger | 1 | 1 | 21 | 0 |
| Theo Johnson | 3 | 4 | 20 | 0 |
| Cam Skattebo | 1 | 2 | 18 | 1 |
| Beaux Collins | 1 | 2 | 18 | 0 |
| Tyrone Tracy Jr. | 2 | 3 | 14 | 0 |
Robinson led the Giants with 48 receiving yards, including a 34-yard gain. New York generated several chunk completions, but the production was spread across eight receivers and rarely developed into touchdown drives.
The Giants’ only passing touchdown went to Skattebo in the first quarter. Their other touchdown did not arrive until Dart’s short run with less than three minutes remaining.
Defensive player stats and pass-rush impact
Philadelphia recorded five sacks, with five different defenders getting to Dart:
| Eagles defender | Sacks | Additional impact |
| Zack Baun | 1 | 6 tackles, 2 tackles for loss, 2 passes defended |
| Jalyx Hunt | 1 | 4 solo tackles |
| Moro Ojomo | 1 | 1 tackle for loss |
| Jordan Davis | 1 | 1 tackle for loss |
| Jalen Carter | 1 | 1 tackle for loss |
The balanced sack distribution is significant. New York could not relieve the pressure by focusing protection on a single edge rusher or interior defender. Philadelphia generated pressure from linebackers, edge players, and defensive tackles.
New York also recorded four sacks. Bobby Okereke, Brian Burns and Rakeem Nunez-Roches each had a full sack, while Dexter Lawrence II and Darius Alexander split another.
The difference was what happened around those sacks. Philadelphia continued creating explosive rushing plays and touchdown passes. New York’s sacks did not consistently end scoring opportunities, while the Eagles’ pressure helped limit the Giants to 13 first downs and 246 total yards.
Team stats that explain Philadelphia’s 38–20 win
| Team statistic | Giants | Eagles |
| Total yards | 246 | 427 |
| Yards per play | 4.9 | 7.5 |
| First downs | 13 | 23 |
| Net passing yards | 178 | 151 |
| Rushing yards | 68 | 276 |
| Third-down conversions | 5/12 | 2/8 |
| Fourth-down conversions | 1/1 | 2/2 |
| Red-zone scoring | 2/3 | 3/3 |
| Sacks recorded | 4 | 5 |
| Turnovers | 0 | 0 |
| Time of possession | 26:45 | 33:15 |
Three numbers stand out.
1. Philadelphia gained 181 more total yards
The Eagles produced 427 yards from only 57 plays, an average of 7.5 yards per snap. New York averaged 4.9.
That gap meant Philadelphia needed fewer long drives to score. Barkley’s 65-yard touchdown and Dotson’s 40-yard reception turned individual plays into immediate scoreboard pressure.
2. The Eagles were perfect in the red zone
Philadelphia scored on all three official red-zone opportunities. The Giants scored on two of three.
The Eagles also converted both fourth-down attempts. Those fourth-down successes helped compensate for an otherwise unimpressive 2-for-8 performance on third down.
3. Turnovers were not the deciding factor
Neither team committed a turnover. Philadelphia therefore created the 18-point margin through execution rather than short fields generated by interceptions or lost fumbles.
The Eagles ran more effectively, finished drives, and forced New York to operate under heavier pass-rush pressure.
What changed from the Giants’ Week 6 victory?
The teams had met only 17 days earlier, when New York won 34–17 at MetLife Stadium.
In that first meeting, Cam Skattebo rushed for 98 yards and three touchdowns, Dart passed for 195 yards and rushed for another score, and the Giants converted 11 of 16 third downs. Philadelphia managed only 73 rushing yards and committed two turnovers.
The statistical reversal was dramatic:
| Category | October 9: Giants win | October 26: Eagles win |
| Final score | Giants 34–17 | Eagles 38–20 |
| Eagles rushing yards | 73 | 276 |
| Giants rushing yards | 172 | 68 |
| Eagles turnovers | 2 | 0 |
| Giants third-down rate | 11/16 | 5/12 |
| Jalen Hurts TD–INT | 1–1 | 4–0 |
| Saquon Barkley rushing | 58 yards | 150 yards |
Philadelphia’s adjustment was not simply “run the ball more.” The Eagles created better blocking angles, produced explosive gains, and avoided the turnovers that had given New York control of the first game.
New York’s Week 6 offense had been balanced and sustainable. Its Week 8 attack became more dependent on Dart creating through the air while facing a five-sack pass rush.
The split results also show why examining only one meeting can create an incomplete picture. The Giants controlled the first matchup, while the Eagles won the rematch through a complete reversal in rushing efficiency and quarterback production.
Biggest individual performances
1. Saquon Barkley
Barkley was the game’s most influential player. He produced the opening touchdown, exceeded 100 yards before halftime, and added a receiving score.
2. Jalen Hurts
Hurts did not need 300 passing yards. His value came from efficiency: four touchdowns, no interceptions, and a 141.5 passer rating.
3. Tank Bigsby
Bigsby turned nine carries into 104 yards. His production prevented the Giants from gaining relief when Barkley was not carrying the ball.
4. Dallas Goedert
Goedert caught only three passes, but two were touchdowns. His performance demonstrates why receiving yards alone do not measure red-zone impact.
5. Philadelphia’s defensive front
Five defenders recorded one sack each. That shared production kept Dart under pressure without relying on one player to dominate every passing down.
6. Jaxson Dart
The final score was unfavorable, but Dart avoided interceptions and accounted for both New York touchdowns. His 193 passing yards and 98.1 passer rating were respectable under frequent pressure.
What the box score means for fans and analysts
The Philadelphia Eagles vs New York Giants match player stats reveal a game decided by efficiency rather than passing volume.
Philadelphia had fewer net passing yards and converted fewer third downs. Under normal circumstances, either statistic could suggest offensive difficulty. However, those weaknesses were outweighed by four touchdown passes, 276 rushing yards, two successful fourth-down conversions, and perfect red-zone scoring.
For fantasy analysis, Barkley and Hurts were the clearest high-impact performers. Goedert’s two-touchdown game provided strong scoring value despite modest yardage, while Bigsby’s 104 yards showed his effectiveness in this matchup. His nine carries, however, should be considered alongside the unusually favorable game script rather than treated as guaranteed weekly volume.
For New York, Dart’s performance provided some encouraging individual signs, but the Giants needed more rushing production and better protection to sustain drives.
More Sports Profiles: Chicago Cubs vs Milwaukee Brewers Match Player Stats
Conclusion
The latest Philadelphia Eagles vs New York Giants match player stats show that the rematch was controlled by Philadelphia’s running game and touchdown efficiency. Barkley and Bigsby combined for 254 rushing yards. Hurts threw four touchdown passes on only 20 attempts. Goedert turned three receptions into two scores, while the Eagles’ defense produced five sacks from five different players. New York generated some productive plays through Dart, but its 68 rushing yards, 13 first downs and 4.9 yards per play were not enough to match Philadelphia’s explosive offense. The 38–20 result ultimately came down to one team consistently turning opportunities into touchdowns while the other struggled to sustain the same level of production.
Frequently asked questions
Who won the latest Eagles vs Giants game?
Philadelphia won 38–20 on October 26, 2025, at Lincoln Financial Field. It was the teams’ second meeting of the 2025 regular season.
What were Jalen Hurts’ statistics against the Giants?
Hurts completed 15 of 20 passes for 179 yards, four touchdowns,s and no interceptions. He also rushed four times for 22 yards and finished with a 141.5 passer rating.
How many rushing yards did Saquon Barkley have?
Barkley rushed 14 times for 150 yards and one touchdown. He also caught four passes for 24 yards and another touchdown.
What were Jaxson Dart’s player stats?
Dart completed 14 of 24 passes for 193 yards, one touchdown, and no interceptions. He rushed six times for 17 yards and scored a two-yard touchdown.
Who led the game in receiving yards?
DeVonta Smith led all players with six receptions for 84 yards. Wan’Dale Robinson led New York with three catches for 48 yards.
How did the Eagles win despite struggling on third down?
Philadelphia converted only two of eight third downs, but it went two-for-two on fourth down, scored on all three red-zone opportunities, and averaged 8.4 yards per rushing attempt. Those high-value plays outweighed the third-down struggles.
Did the Eagles and Giants split their 2025 games?
Yes. New York won the first meeting 34–17 on October 9, while Philadelphia won the rematch 38–20 on October 26.
What is the all-time Eagles vs Giants record?
Following their 2025 meetings, Philadelphia held a 96–89–2 advantage across regular-season and postseason games.