



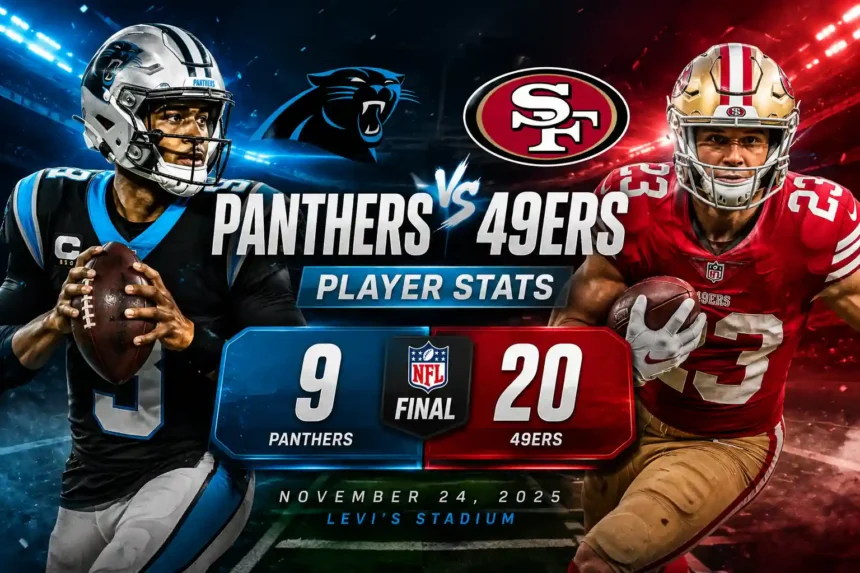
The latest Carolina Panthers vs 49ers match player stats show that San Francisco defeated Carolina 20–9 at Levi’s Stadium on November 24, 2025. Christian McCaffrey led the game with 142 yards from scrimmage and one rushing touchdown, while George Kittle recorded 78 receiving yards. San Francisco won despite Brock Purdy throwing three interceptions because the 49ers controlled possession, rushed for 147 yards and held Carolina to one third-down conversion.
- Panthers vs 49ers result at a glance
- Carolina Panthers vs 49ers match player stats
- Quarterback comparison: Brock Purdy vs Bryce Young
- Christian McCaffrey controlled the game
- Receiving leaders and target distribution
- Defensive player stats and five combined interceptions
- Team stats that explain the 20–9 result
- San Francisco established the run
- Carolina could not stay on the field
- Red-zone execution separated the teams
- Complete scoring timeline
- Why the 49ers won despite three turnovers
- 1. McCaffrey provided offensive stability
- 2. The 49ers dominated possession
- 3. Third-down defense stopped Carolina
- 4. Brown answered Carolina’s takeaways
- Where Carolina fell short
- Most important statistical takeaways
- Conclusion
- Frequently asked questions
- Who won the latest Carolina Panthers vs 49ers game?
- Who had the most rushing yards?
- Who led the game in receiving yards?
- What were Brock Purdy’s stats against Carolina?
- What were Bryce Young’s stats against the 49ers?
- How many total yards did Christian McCaffrey record?
- Who recorded the most interceptions?
- What was the biggest statistical difference between the teams?
Panthers vs 49ers result at a glance
| Game detail | Information |
| Final score | San Francisco 49ers 20, Carolina Panthers 9 |
| Date | November 24, 2025 |
| Week | NFL Week 12 |
| Venue | Levi’s Stadium, Santa Clara, California |
| Carolina record after game | 6–6 |
| San Francisco record after game | 8–4 |
| Leading passer | Brock Purdy, 193 yards |
| Leading rusher | Christian McCaffrey, 89 yards |
| Leading receiver | George Kittle, 78 yards |
| Leading all-purpose player | Christian McCaffrey, 142 scrimmage yards |
San Francisco led after every quarter. Carolina stayed within one possession for much of the game, largely because its defense intercepted Purdy three times in the first half. The Panthers’ offense could not consistently turn those takeaways into points.
Carolina Panthers vs 49ers match player stats
Main offensive performers
| Player | Team | Key statistics |
| Brock Purdy | 49ers | 23/32, 193 passing yards, 1 TD, 3 INT |
| Bryce Young | Panthers | 18/29, 169 passing yards, 1 TD, 2 INT |
| Christian McCaffrey | 49ers | 24 carries, 89 yards, 1 TD; 7 catches, 53 yards |
| Brian Robinson Jr. | 49ers | 7 carries, 40 yards |
| Rico Dowdle | Panthers | 6 carries, 38 yards; 4 catches, 36 yards |
| George Kittle | 49ers | 6 receptions, 78 yards |
| Jauan Jennings | 49ers | 5 receptions, 41 yards, 1 TD |
| Tetairoa McMillan | Panthers | 2 receptions, 35 yards, 1 TD |
| Jalen Coker | Panthers | 3 receptions, 32 yards |
| Chuba Hubbard | Panthers | 3 carries, 16 yards; 4 catches, 27 yards |
McCaffrey produced the most complete offensive performance. He accounted for 89 rushing yards and 53 receiving yards, giving him 142 yards from scrimmage. Dowdle led Carolina with 74 scrimmage yards despite receiving only six rushing attempts.
Quarterback comparison: Brock Purdy vs Bryce Young
Neither quarterback produced a clean statistical performance.
| Statistic | Bryce Young | Brock Purdy |
| Completions/attempts | 18/29 | 23/32 |
| Completion rate | 62.1% | 71.9% |
| Passing yards | 169 | 193 |
| Yards per attempt | 5.8 | 6.0 |
| Passing touchdowns | 1 | 1 |
| Interceptions | 2 | 3 |
| Sacks taken | 1 | 0 |
| Passer rating | 60.8 | 58.5 |
Purdy completed a higher percentage of his throws and finished with 24 more passing yards, but his three interceptions kept Carolina in the game. All three picks came on passes traveling at least 20 yards downfield, according to the NFL’s Next Gen Stats analysis.
After the turnovers, San Francisco reduced its reliance on aggressive downfield throws. The offense leaned more heavily on McCaffrey, the running game and shorter completions.
Young threw fewer interceptions, but both of his turnovers stopped promising Carolina possessions. Ji’Ayir Brown intercepted him in the end zone during the first half and added another interception in the fourth quarter when the Panthers were trying to cut into the lead.
Young also struggled when San Francisco used man coverage. Against those looks, he completed only two of seven attempts for 11 yards and threw both of his interceptions.
Christian McCaffrey controlled the game
McCaffrey was the central figure in San Francisco’s offense:
- 24 rushing attempts
- 89 rushing yards
- 1 rushing touchdown
- 7 receptions
- 53 receiving yards
- 142 total yards from scrimmage
- 31 offensive touches
He did not produce one unusually long play. Instead, his value came from consistent carries, short receptions and the ability to keep San Francisco ahead of the chains.
His 12-yard touchdown run in the third quarter completed a 13-play, 80-yard drive and extended the 49ers’ lead to 17–3. That drive consumed 7:43 and demonstrated the difference between the teams: San Francisco could sustain possessions, while Carolina repeatedly left the field on third down.
McCaffrey also reached a notable receiving milestone. He became the third running back in NFL history to record at least 50 receiving yards in 50 career games, joining Larry Centers and Marshall Faulk.
Receiving leaders and target distribution
San Francisco 49ers receivers
| Player | Receptions | Targets | Yards | Average | TD |
| George Kittle | 6 | 10 | 78 | 13.0 | 0 |
| Christian McCaffrey | 7 | 7 | 53 | 7.6 | 0 |
| Jauan Jennings | 5 | 7 | 41 | 8.2 | 1 |
| Demarcus Robinson | 1 | 1 | 8 | 8.0 | 0 |
| Ricky Pearsall | 2 | 4 | 6 | 3.0 | 0 |
| Brian Robinson Jr. | 1 | 2 | 4 | 4.0 | 0 |
| Luke Farrell | 1 | 1 | 3 | 3.0 | 0 |
Kittle led all receivers with 78 yards and provided San Francisco’s most productive downfield option. Jennings caught the game’s opening touchdown, a 12-yard reception that completed a 15-play drive.
McCaffrey caught all seven of his targets. His perfect catch rate gave Purdy a dependable outlet after Carolina’s secondary punished several deeper throws.
Carolina Panthers receivers
| Player | Receptions | Targets | Yards | Average | TD |
| Rico Dowdle | 4 | 4 | 36 | 9.0 | 0 |
| Tetairoa McMillan | 2 | 7 | 35 | 17.5 | 1 |
| Jalen Coker | 3 | 4 | 32 | 10.7 | 0 |
| Chuba Hubbard | 4 | 4 | 27 | 6.8 | 0 |
| Xavier Legette | 3 | 5 | 22 | 7.3 | 0 |
| Jimmy Horn Jr. | 1 | 1 | 11 | 11.0 | 0 |
| Ja’Tavion Sanders | 1 | 1 | 6 | 6.0 | 0 |
McMillan scored Carolina’s only touchdown on a 29-yard pass late in the third quarter. However, he caught only two of his seven targets. The Panthers did not have a receiver reach 40 yards, making it difficult to generate explosive or sustained passing production.
Defensive player stats and five combined interceptions
The defenses produced five interceptions, making turnovers one of the game’s defining themes.
Carolina defensive standouts
Jaycee Horn intercepted Purdy twice in the first half. Mike Jackson added a third interception by taking the ball away in the end zone. Those plays allowed Carolina to reach halftime trailing only 10–3 despite being outgained and running far fewer offensive plays.
Krys Barnes recorded a game-high 10 tackles in his first start of the season. Carolina’s defense played 70 snaps, compared with only 46 offensive snaps for the Panthers, reflecting San Francisco’s possession advantage.
San Francisco defensive standouts
Ji’Ayir Brown delivered San Francisco’s biggest defensive performance:
| Statistic | Ji’Ayir Brown |
| Total tackles | 5 |
| Solo tackles | 4 |
| Interceptions | 2 |
| Interception return yards | 4 |
His first interception prevented Carolina from scoring after Young moved the offense close to the goal line. His second ended another drive in San Francisco territory during the fourth quarter. Brown was subsequently named NFC Defensive Player of the Week for his performance.
Clelin Ferrell recorded San Francisco’s only sack, dropping Young for an eight-yard loss during the fourth quarter. The 49ers did not need a high sack total because their coverage, situational pressure and third-down defense disrupted Carolina’s passing attack.
Team stats that explain the 20–9 result
| Team statistic | Panthers | 49ers |
| Total yards | 230 | 340 |
| Passing yards | 161 net | 193 net |
| Rushing yards | 69 | 147 |
| Rushing attempts | 13 | 38 |
| First downs | 12 | 23 |
| Third-down conversions | 1/7 | 7/13 |
| Red-zone conversions | 0/2 | 2/3 |
| Turnovers | 2 | 3 |
| Time of possession | 22:18 | 37:42 |
| Penalties | 4 | 2 |
| Penalty yards | 30 | 6 |
The turnover column favors Carolina, but nearly every other major team statistic favors San Francisco. The 49ers gained 110 more yards, recorded 11 more first downs and possessed the ball for over 15 additional minutes.
San Francisco established the run
The 49ers called 38 rushing attempts and gained 147 yards. Carolina ran only 13 times for 69 yards.
Dowdle averaged 6.3 yards per carry and Hubbard averaged 5.3, but they received only nine combined attempts. Carolina therefore moved away from a part of its offense that was producing reasonable efficiency.
Carolina could not stay on the field
The Panthers converted only one of seven third downs. Three of their first five possessions ended in three-and-outs, and they ran just 19 plays for 72 yards during the first half.
San Francisco converted seven of 13 third downs and produced multiple long drives. That difference allowed the 49ers to overcome their three interceptions and continue creating scoring opportunities.
Red-zone execution separated the teams
Carolina entered the red zone twice but did not score a touchdown on either opportunity. San Francisco converted two of its three red-zone visits.
The clearest example came in the first half. After Horn’s interception gave Carolina favorable field position, Young scrambled close to the goal line but then threw an interception to Brown in the end zone. A potential momentum-changing touchdown became another empty possession.
Complete scoring timeline
| Quarter | Scoring play | Score |
| First | Jauan Jennings 12-yard touchdown catch from Brock Purdy | SF 7–0 |
| Second | Ryan Fitzgerald 25-yard field goal | SF 7–3 |
| Second | Matt Gay 47-yard field goal | SF 10–3 |
| Third | Christian McCaffrey 12-yard touchdown run | SF 17–3 |
| Third | Tetairoa McMillan 29-yard touchdown catch from Bryce Young; conversion failed | SF 17–9 |
| Fourth | Matt Gay 29-yard field goal | SF 20–9 |
Carolina did not score in the first or fourth quarters. Its touchdown briefly reduced the deficit to eight points, but San Francisco answered with a long fourth-quarter drive ending in Gay’s second field goal.
Why the 49ers won despite three turnovers
San Francisco’s victory can be explained through four statistical advantages.
1. McCaffrey provided offensive stability
After Purdy’s interceptions, San Francisco could shift toward a proven rushing and short-passing option. McCaffrey’s 31 touches helped the 49ers avoid placing the entire game on their quarterback.
2. The 49ers dominated possession
San Francisco held the ball for 37:42. Longer possessions reduced the opportunities available to Carolina and forced the Panthers’ defense to remain on the field for 70 snaps.
3. Third-down defense stopped Carolina
Holding an opponent to one conversion in seven third-down attempts can offset other problems. Carolina could not build enough sustained drives to take advantage of its three interceptions.
4. Brown answered Carolina’s takeaways
Horn and Jackson gave Carolina three takeaways, but Brown’s two interceptions restored part of the turnover balance. Both of his picks came in scoring situations, increasing their value beyond the raw interception total.
Where Carolina fell short
The Panthers’ defense did enough to keep the game competitive. The offense did not match that performance.
Carolina’s main problems were:
- Only 12 first downs
- One third-down conversion
- No red-zone touchdowns
- Nine combined carries for Dowdle and Hubbard
- Two interceptions in San Francisco territory
- No receiver above 36 yards
- Just 22:18 of possession
The limited rushing workload stands out. Dowdle and Hubbard combined for 54 yards on nine carries, an average of six yards per attempt. A more persistent running game might have reduced the pressure on Young and created more manageable third downs.
Most important statistical takeaways
The box score tells a more detailed story than the 11-point margin:
- San Francisco won through control rather than explosive scoring. The 49ers used possession, first downs and rushing volume to gradually separate from Carolina.
- Carolina’s three interceptions were not enough. The Panthers scored only three points from their first-half takeaways.
- McCaffrey was the game’s most valuable offensive player. His 142 scrimmage yards exceeded the output of any other skill-position player.
- Both quarterbacks struggled with turnovers. Purdy and Young combined for five interceptions and passer ratings below 61.
- Situational football decided the result. San Francisco performed better on third down and in the red zone, where possessions have the greatest effect on scoring.
Conclusion
The Carolina Panthers vs 49ers match player stats reveal a game decided by possession, rushing volume and situational execution rather than quarterback dominance. San Francisco survived Purdy’s three interceptions because McCaffrey generated 142 yards from scrimmage, Kittle led all receivers, and the 49ers controlled the ball for nearly 38 minutes. Carolina’s defense created opportunities, especially through Horn’s two interceptions, but the offense converted only one third down and failed to score a red-zone touchdown.
The 20–9 result was therefore not simply about total yardage. San Francisco won because it produced longer drives, protected its lead with the running game and made the most important defensive plays when Carolina entered scoring territory.
Frequently asked questions
Who won the latest Carolina Panthers vs 49ers game?
The San Francisco 49ers defeated the Carolina Panthers 20–9 on November 24, 2025, at Levi’s Stadium. San Francisco improved to 8–4, while Carolina fell to 6–6.
Who had the most rushing yards?
Christian McCaffrey led the game with 89 rushing yards on 24 carries. He also scored a 12-yard rushing touchdown in the third quarter.
Who led the game in receiving yards?
George Kittle led all players with 78 receiving yards on six catches. He was targeted 10 times and averaged 13 yards per reception.
What were Brock Purdy’s stats against Carolina?
Purdy completed 23 of 32 passes for 193 yards, one touchdown and three interceptions. He finished with a passer rating of approximately 58.5 and was not sacked.
What were Bryce Young’s stats against the 49ers?
Young completed 18 of 29 passes for 169 yards, one touchdown and two interceptions. He also rushed four times for 15 yards and was sacked once.
How many total yards did Christian McCaffrey record?
McCaffrey recorded 142 yards from scrimmage: 89 rushing yards and 53 receiving yards. He caught all seven of his targets and scored one rushing touchdown.
Who recorded the most interceptions?
Jaycee Horn intercepted Brock Purdy twice for Carolina, while Ji’Ayir Brown intercepted Bryce Young twice for San Francisco. Mike Jackson recorded the game’s other interception.
What was the biggest statistical difference between the teams?
Time of possession and rushing volume were the clearest differences. San Francisco possessed the ball for 37:42 and attempted 38 runs, while Carolina had the ball for 22:18 and attempted only 13 runs.