



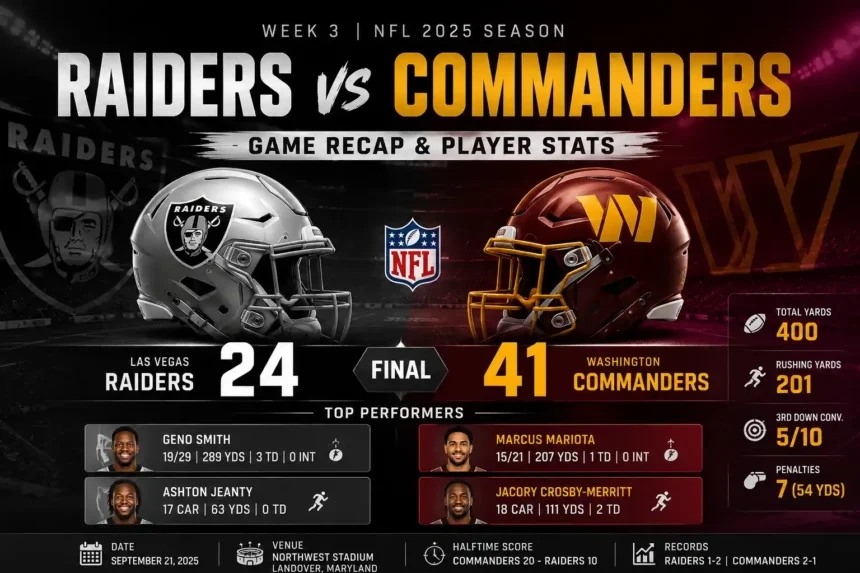
The Las Vegas Raiders vs Washington Commanders match player stats tell the story of a game decided by Washington’s rushing attack, explosive special teams and balanced offensive production. The Commanders defeated the Raiders 41–24 on September 21, 2025, despite Las Vegas quarterback Geno Smith throwing for 289 yards and three touchdowns. Washington rushed for 201 yards, received touchdowns from several different players and controlled the middle portion of the game to build a lead the Raiders could not overcome.
- Raiders vs Commanders Game Summary
- Quarter-by-Quarter Score
- Las Vegas Raiders vs Washington Commanders Team Stats
- Quarterback Player Stats
- Las Vegas Raiders Rushing Stats
- Washington Commanders Rushing Stats
- Raiders Receiving Player Stats
- Washington Commanders Receiving Player Stats
- Defensive Player Stats and Pass-Rush Impact
- Special-Teams Stats Changed the Game
- Top Player Performances
- 1. Tre Tucker, Raiders
- 2. Marcus Mariota, Commanders
- 3. Jeremy McNichols, Commanders
- 4. Jaylin Lane, Commanders
- 5. Geno Smith, Raiders
- 6. Luke McCaffrey, Commanders
- Why the Commanders Won 41–24
- Washington Controlled the Ground Game
- Explosive Plays Came From Multiple Units
- The Commanders Won on Third Down
- Washington Pressured Geno Smith
- Las Vegas Could Not Recover From the Third Quarter
- What the Player Stats Reveal
- More Sports Profiles: Seattle Storm vs Golden State Valkyries Match Player Stats
- Conclusion
- Frequently Asked Questions
- Who won the Las Vegas Raiders vs Washington Commanders game?
- Who had the most passing yards?
- Who scored the Raiders’ touchdowns?
- Who was Washington’s leading rusher?
- How many rushing yards did the Commanders record?
- How did Marcus Mariota perform?
- Which special-teams player had the biggest impact?
- How many times was Geno Smith sacked?
Raiders vs Commanders Game Summary
Washington entered the matchup without starting quarterback Jayden Daniels, but backup Marcus Mariota delivered an efficient performance. He completed 15 of 21 passes for 207 yards, threw one touchdown and added another score on the ground.
Las Vegas generated more passing yards, largely through the connection between Geno Smith and Tre Tucker. However, the Raiders struggled to run the ball, protect their quarterback and prevent major plays on special teams.
Washington scored in every quarter and led 20–10 at halftime. The Commanders then added 14 unanswered points in the third quarter, creating a 34–10 advantage before Las Vegas scored twice in the final period.
Game Information
| Detail | Information |
| Matchup | Las Vegas Raiders at Washington Commanders |
| Date | September 21, 2025 |
| Competition | 2025 NFL regular season, Week 3 |
| Venue | Northwest Stadium, Landover, Maryland |
| Final score | Commanders 41, Raiders 24 |
| Halftime score | Commanders 20, Raiders 10 |
| Raiders record after game | 1–2 |
| Commanders record after game | 2–1 |
The official scoring summary confirms that Washington outscored Las Vegas in each of the first three quarters before the Raiders produced 14 late points.
Quarter-by-Quarter Score
| Team | Q1 | Q2 | Q3 | Q4 | Final |
| Las Vegas Raiders | 3 | 7 | 0 | 14 | 24 |
| Washington Commanders | 7 | 13 | 14 | 7 | 41 |
The third quarter was the turning point. Washington entered the second half with a 10-point advantage and stretched it to 24 before Las Vegas could respond.
Las Vegas Raiders vs Washington Commanders Team Stats
Washington did not dominate every statistical category. The Raiders actually finished with more passing yards, while both teams recorded 17 first downs.
The difference came from rushing production, field position and drive efficiency.
| Team statistic | Raiders | Commanders |
| Total yards | 354 | 400 |
| Passing yards | 261 | 199 |
| Rushing yards | 93 | 201 |
| First downs | 17 | 17 |
| Turnovers | 0 | 1 |
| Third-down conversions | 3 of 14 | 5 of 10 |
| Penalties | 6 for 54 yards | 7 for 54 yards |
| Sacks allowed | 5 | 1 |
Washington’s 201 rushing yards were more than double Las Vegas’ total. The Commanders also converted half of their third downs, while the Raiders converted only three of 14 attempts.
The Raiders protected the football, but avoiding turnovers was not enough to compensate for poor field position, five sacks and limited rushing efficiency.
Quarterback Player Stats
Geno Smith’s Production Came Under Heavy Pressure
Geno Smith produced the larger passing total and finished without an interception.
| Player | Completions/Attempts | Passing yards | TD | INT | Sacks | Rating |
| Geno Smith | 19/29 | 289 | 3 | 0 | 5 | 132.7 |
| Marcus Mariota | 15/21 | 207 | 1 | 0 | 1 | 118.6 |
Smith averaged 10 yards per pass attempt and threw all three Las Vegas touchdowns. His final passer rating of 132.7 reflects an efficient statistical performance.
However, the timing of the production matters. Washington had already built a commanding advantage before the Raiders scored twice in the fourth quarter. Smith also lost 28 yards on five sacks, which repeatedly disrupted Las Vegas drives.
Marcus Mariota Delivered a Balanced Performance
Mariota did not need a high-volume passing game. He completed 71.4% of his attempts and avoided turnovers while Washington leaned on its running backs and special teams.
His complete stat line included:
- 15 completions on 21 attempts
- 207 passing yards
- One passing touchdown
- No interceptions
- 40 rushing yards
- One rushing touchdown
- One sack taken
Mariota’s ability to contribute as both a passer and runner helped Washington replace some of the mobility normally provided by Daniels. The Commanders also confirmed that this was Mariota’s 75th career start and his first career victory over the Raiders.
Las Vegas Raiders Rushing Stats
The Raiders gave Ashton Jeanty 17 carries, but Washington prevented him from controlling the game.
| Player | Attempts | Yards | Average | Long | TD |
| Ashton Jeanty | 17 | 63 | 3.7 | 18 | 0 |
| Zamir White | 5 | 19 | 3.8 | 9 | 0 |
| Geno Smith | 2 | 5 | 2.5 | 3 | 0 |
| Tre Tucker | 1 | 4 | 4.0 | 4 | 0 |
| Dylan Laube | 3 | 2 | 0.7 | 2 | 0 |
Las Vegas finished with 93 rushing yards on 28 attempts, an average of approximately 3.3 yards per carry.
Jeanty showed flashes, including an 18-yard run, but he did not score and generated only three rushing first downs. Once Washington built a large lead, the Raiders had to move away from a balanced approach and rely more heavily on Smith’s arm.
Washington Commanders Rushing Stats
Washington’s ground game was deeper, more explosive and more productive.
| Player | Attempts | Yards | Average | Long | TD |
| Jeremy McNichols | 4 | 78 | 19.5 | 60 | 1 |
| Marcus Mariota | 6 | 40 | 6.7 | 22 | 1 |
| Chris Rodriguez Jr. | 11 | 39 | 3.5 | 14 | 0 |
| Jacory Croskey-Merritt | 8 | 26 | 3.3 | 9 | 1 |
| Deebo Samuel | 3 | 18 | 6.0 | 9 | 0 |
Jeremy McNichols produced the game’s longest rushing play, breaking free for a 60-yard touchdown. That run gave Washington an explosive element that the Raiders could not match.
Mariota added 40 yards and a score, while Jacory Croskey-Merritt contributed another rushing touchdown. Five Washington players recorded at least 18 rushing yards, making the attack difficult to predict.
The Commanders finished with 201 rushing yards and three rushing touchdowns.
Raiders Receiving Player Stats
Tre Tucker delivered the most productive receiving performance of the game.
| Player | Targets | Receptions | Yards | Average | Long | TD |
| Tre Tucker | 9 | 8 | 145 | 18.1 | 61 | 3 |
| Jakobi Meyers | 4 | 3 | 63 | 21.0 | 45 | 0 |
| Brock Bowers | 5 | 4 | 38 | 9.5 | 18 | 0 |
| Dont’e Thornton Jr. | 4 | 2 | 29 | 14.5 | 20 | 0 |
| Jack Bech | 1 | 1 | 10 | 10.0 | 10 | 0 |
| Zamir White | 2 | 1 | 4 | 4.0 | 4 | 0 |
Tre Tucker’s Breakout Game
Tucker caught eight of his nine targets for 145 yards and all three Las Vegas touchdowns.
His 61-yard touchdown was the Raiders’ longest offensive play. He accounted for slightly more than half of Smith’s passing yardage and every Las Vegas touchdown.
Tucker’s numbers were excellent, but they also reveal how concentrated the offense became. No other Raider scored, and only Jakobi Meyers exceeded 40 receiving yards.
Brock Bowers caught four passes, but Washington limited him to 38 yards. For a player normally capable of creating matchup problems across the formation, that was a relatively quiet performance.
Washington Commanders Receiving Player Stats
Washington distributed the football more evenly.
| Player | Targets | Receptions | Yards | Average | Long | TD |
| Terry McLaurin | 4 | 3 | 74 | 24.7 | 56 | 0 |
| Luke McCaffrey | 3 | 3 | 56 | 18.7 | 43 | 1 |
| Zach Ertz | 3 | 3 | 38 | 12.7 | 19 | 0 |
| Chris Moore | 2 | 2 | 25 | 12.5 | 13 | 0 |
| Deebo Samuel | 3 | 2 | 11 | 5.5 | 9 | 0 |
| Jacory Croskey-Merritt | 1 | 1 | 5 | 5.0 | 5 | 0 |
| Jaylin Lane | 2 | 1 | -2 | -2.0 | -2 | 0 |
Terry McLaurin led Washington with 74 receiving yards, including a 56-yard gain. Luke McCaffrey caught all three of his targets and scored on a 43-yard reception.
Mariota completed passes to seven different players. That distribution prevented the Raiders from focusing on one primary target.
Zach Ertz also provided a reliable short and intermediate option by catching each of his three targets.
Defensive Player Stats and Pass-Rush Impact
The raw offensive tables do not fully explain the result. Washington’s pass rush played a major role by sacking Geno Smith five times.
Las Vegas recorded only one sack, which came from Maxx Crosby.
Leading Raiders Defenders
| Player | Total tackles | Sacks | Interceptions |
| Maxx Crosby | 7 | 1.0 | 0 |
| Devin White | 6 | 0 | 0 |
| Elandon Roberts | 5 | 0 | 0 |
| Germaine Pratt | 5 | 0 | 0 |
| Adam Butler | 5 | 0 | 0 |
| Jeremy Chinn | 5 | 0 | 0 |
| Isaiah Pola-Mao | 5 | 0 | 0 |
Crosby remained active with seven tackles and the Raiders’ only sack. However, Las Vegas could not generate enough consistent pressure to force Mariota into mistakes.
Washington lost one turnover but did not throw an interception. Mariota’s clean passing performance allowed the Commanders to stay ahead of the chains.
Washington’s Defensive Advantage
Washington’s defensive front repeatedly collapsed the pocket. The five sacks cost Las Vegas 28 yards and made third-and-long situations more common.
That pressure helps explain why the Raiders converted only 21.4% of their third downs, despite Smith’s strong passer rating.
The Commanders did not need an interception to control the matchup. Their sacks, run defense and field-position advantage produced enough negative plays.
Special-Teams Stats Changed the Game
Special teams provided one of the clearest differences between the teams.
Jaylin Lane’s 90-Yard Punt-Return Touchdown
Jaylin Lane returned five punts for 127 yards, including a 90-yard touchdown.
| Returner | Returns | Yards | Average | Long | TD |
| Jaylin Lane | 5 punts | 127 | 25.4 | 90 | 1 |
| Deebo Samuel | 2 kickoffs | 93 | 46.5 | 69 | 0 |
| Luke McCaffrey | 1 kickoff | 25 | 25.0 | 25 | 0 |
Lane’s touchdown allowed Washington to score without placing its offense on the field. Deebo Samuel also generated 93 kickoff-return yards, including a 69-yard return.
Washington’s returns repeatedly created favorable field position. By comparison, Las Vegas averaged 22 yards on five kickoff returns and five yards on two punt returns.
Raiders punter A.J. Cole averaged 49 yards per punt, but Washington’s returns reduced his net average to 27.8 yards.
Kicking Stats
| Kicker | Field goals | Extra points | Total kicking points |
| Daniel Carlson | 1/1 | 1/1 | 4 |
| Matt Gay | 2/3 | 5/5 | 11 |
Matt Gay made field goals from long range, including a 56-yarder, although he missed one attempt. Daniel Carlson converted his only field goal and extra-point attempt.
Top Player Performances
1. Tre Tucker, Raiders
Tucker was the leading receiver in the game and produced every Las Vegas touchdown.
Stat line: Eight receptions, 145 yards and three touchdowns.
His combination of volume and explosive plays gave the Raiders a chance to improve the final score after falling far behind.
2. Marcus Mariota, Commanders
Mariota provided efficient, mistake-free quarterback play.
Stat line: 207 passing yards, 40 rushing yards and two total touchdowns.
He did not need to carry the offense because Washington received major contributions from its running game and return units.
3. Jeremy McNichols, Commanders
McNichols turned only four carries into 78 yards.
Stat line: Four attempts, 78 yards and one touchdown.
His 60-yard scoring run was one of the decisive explosive plays.
4. Jaylin Lane, Commanders
Lane made his largest impact on special teams.
Stat line: Five punt returns, 127 yards and one touchdown.
His 90-yard punt return placed Washington firmly in control and highlighted Las Vegas’ coverage problems.
5. Geno Smith, Raiders
Smith’s final passing statistics were impressive despite the result.
Stat line: 19 of 29 passing, 289 yards, three touchdowns and no interceptions.
However, five sacks and the game situation reduced the practical value of those numbers.
6. Luke McCaffrey, Commanders
McCaffrey made the most of limited opportunities.
Stat line: Three receptions, 56 yards and one touchdown.
He caught every pass thrown in his direction, including a 43-yard score.
Why the Commanders Won 41–24
Washington Controlled the Ground Game
The Commanders gained 201 rushing yards compared with 93 for Las Vegas.
That advantage allowed Washington to stay balanced, manage the clock and avoid placing too much responsibility on its backup quarterback.
Explosive Plays Came From Multiple Units
Washington produced:
- A 60-yard McNichols rushing touchdown
- A 43-yard McCaffrey receiving touchdown
- A 56-yard McLaurin reception
- A 90-yard Lane punt-return touchdown
- A 69-yard Samuel kickoff return
Las Vegas had explosive passes to Tucker and Meyers, but Washington created game-changing plays through offense and special teams.
The Commanders Won on Third Down
Washington converted five of 10 third downs. Las Vegas converted only three of 14.
That difference helped Washington sustain drives while repeatedly forcing the Raiders to punt.
Washington Pressured Geno Smith
Five sacks prevented Smith from consistently building on his successful downfield completions.
The Raiders’ passing numbers looked strong, but their protection problems made the offense unreliable from drive to drive.
Las Vegas Could Not Recover From the Third Quarter
Washington scored 14 points in the third period while keeping Las Vegas scoreless.
By the beginning of the fourth quarter, the Commanders held a 34–10 lead. The Raiders’ late touchdowns improved the final margin but did not seriously threaten Washington’s control.
What the Player Stats Reveal
The Las Vegas Raiders vs Washington Commanders match player stats demonstrate why box-score totals need context.
Smith threw for more yards and touchdowns than Mariota. Tucker was the game’s leading receiver. Las Vegas also committed fewer turnovers.
Yet Washington won comfortably because it performed better in several high-impact areas:
- Rushing production
- Quarterback pressure
- Third-down efficiency
- Special-teams returns
- Explosive-play distribution
- Second-half scoring
The Raiders relied heavily on one passing connection. Washington received meaningful contributions from Mariota, McNichols, McCaffrey, Lane, Croskey-Merritt, McLaurin and its defensive front.
That balance was the defining statistical difference.
More Sports Profiles: Seattle Storm vs Golden State Valkyries Match Player Stats
Conclusion
The Las Vegas Raiders vs Washington Commanders match player stats show a clear contrast between individual passing production and complete team performance. Geno Smith and Tre Tucker generated excellent numbers, but Washington controlled the ground game, created more explosive plays, pressured the quarterback and dominated the return phase. Mariota’s efficient two-touchdown performance gave the offense stability, while McNichols, McCaffrey, Lane and the defensive front supplied the decisive moments. Washington’s 41–24 victory was not built around one superstar. It came from balanced contributions across offense, defense and special teams.
Frequently Asked Questions
Who won the Las Vegas Raiders vs Washington Commanders game?
The Washington Commanders won 41–24 on September 21, 2025, at Northwest Stadium in Landover, Maryland.
Who had the most passing yards?
Geno Smith led the game with 289 passing yards. Marcus Mariota finished with 207 yards for Washington.
Who scored the Raiders’ touchdowns?
Tre Tucker scored all three Las Vegas touchdowns. He caught eight passes for 145 yards.
Who was Washington’s leading rusher?
Jeremy McNichols led Washington with 78 rushing yards on four carries. His performance included a 60-yard touchdown.
How many rushing yards did the Commanders record?
Washington finished with 201 rushing yards. Las Vegas recorded 93.
How did Marcus Mariota perform?
Mariota completed 15 of 21 passes for 207 yards and one touchdown. He also rushed six times for 40 yards and another touchdown.
Which special-teams player had the biggest impact?
Jaylin Lane had the largest special-teams impact. He returned five punts for 127 yards, including a 90-yard touchdown.
How many times was Geno Smith sacked?
Washington sacked Smith five times for a total loss of 28 yards. The Raiders recorded only one sack against Mariota.